Linux的netstat命令详解
发布日期:2021-12-27 11:28 | 文章来源:CSDN
Linux的netstat命令
1、TCP连接状态详解
- LISTEN: 侦听来自远方的TCP端口的连接请求
- SYN-SENT: 再发送连接请求后等待匹配的连接请求
- SYN-RECEIVED:再收到和发送一个连接请求后等待对方对连接请求的确认
- ESTABLISHED: 代表一个打开的连接
- FIN-WAIT-1: 等待远程TCP连接中断请求,或先前的连接中断请求的确认
- FIN-WAIT-2: 从远程TCP等待连接中断请求
- CLOSE-WAIT: 等待从本地用户发来的连接中断请求
- CLOSING: 等待远程TCP对连接中断的确认
- LAST-ACK: 等待原来的发向远程TCP的连接中断请求的确认
- TIME-WAIT: 等待足够的时间以确保远程TCP接收到连接中断请求的确认
- CLOSED: 没有任何连接状态
2、命令格式
netstat(选项)
3、命令选项
- -a或–all:显示所有连线中的Socket;
- -A<网络类型>或–<网络类型>:列出该网络类型连线中的相关地址;
- -c或–continuous:持续列出网络状态;
- -C或–cache:显示路由器配置的快取信息;
- -e或–extend:显示网络其他相关信息;
- -F或–fib:显示FIB;
- -g或–groups:显示多重广播功能群组组员名单;
- -h或–help:在线帮助;
- -i或–interfaces:显示网络界面信息表单;
- -l或–listening:显示监控中的服务器的Socket;
- -M或–masquerade:显示伪装的网络连线;
- -n或–numeric:直接使用ip地址,而不通过域名服务器;
- -N或–netlink或–symbolic:显示网络硬件外围设备的符号连接名称;
- -o或–timers:显示计时器;
- -p或–programs:显示正在使用Socket的程序识别码和程序名称;
- -r或–route:显示Routing Table;
- -s或–statistice:显示网络工作信息统计表;
- -t或–tcp:显示TCP传输协议的连线状况;
- -u或–udp:显示UDP传输协议的连线状况;
- -v或–verbose:显示指令执行过程;
- -V或–version:显示版本信息;
- -w或–raw:显示RAW传输协议的连线状况;
- -x或–unix:此参数的效果和指定"-A unix"参数相同;
- –ip或–inet:此参数的效果和指定"-A inet"参数相同。
4、列出所有端口(包含TCP和UDP)
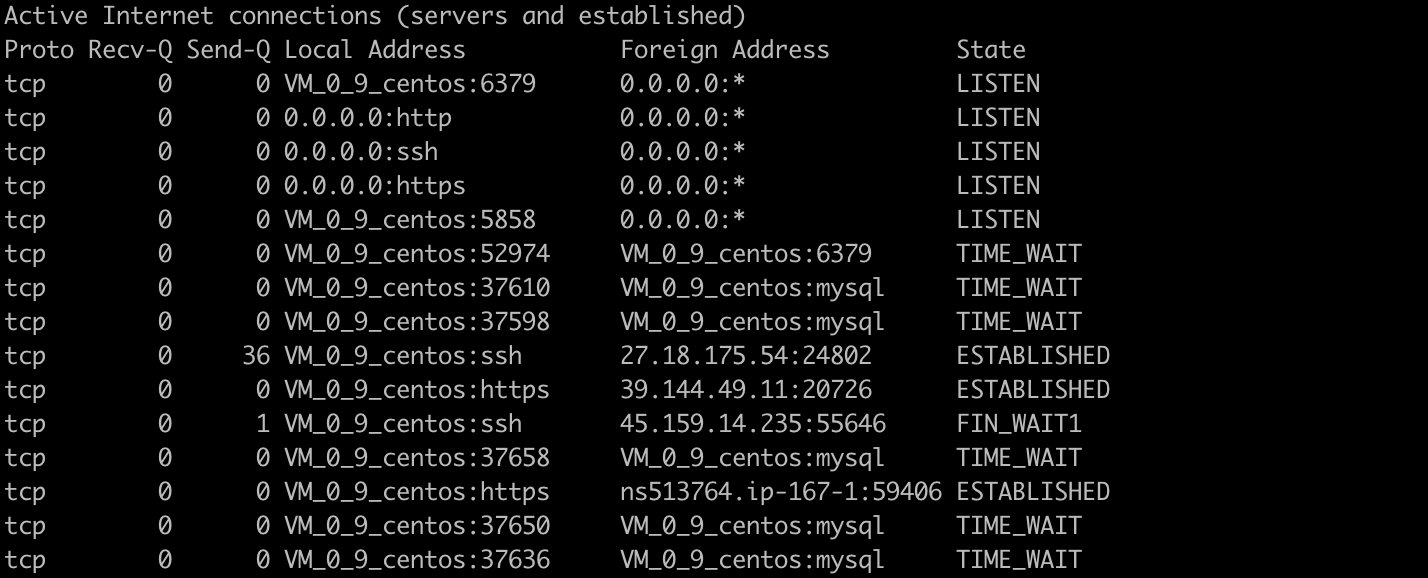
> netstat -a
4、列出所有TCP端口
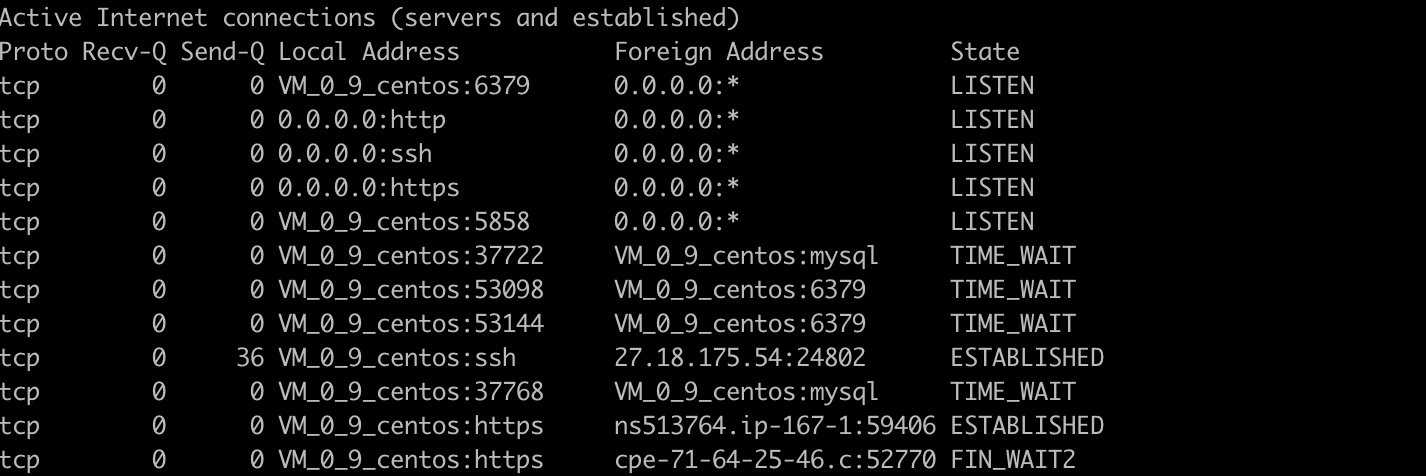
> netstat -at
5、列出所有UDP端口
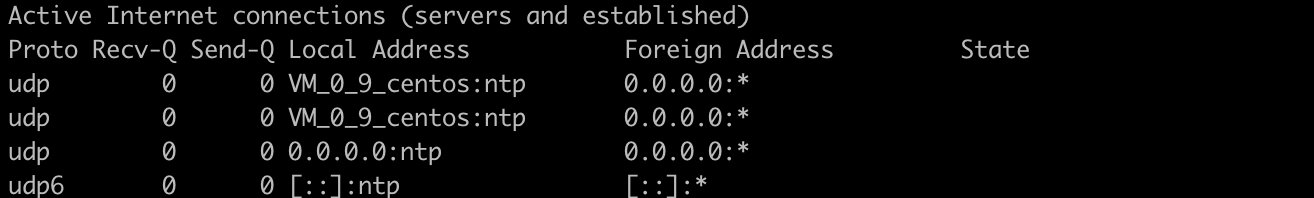
> netstat -au
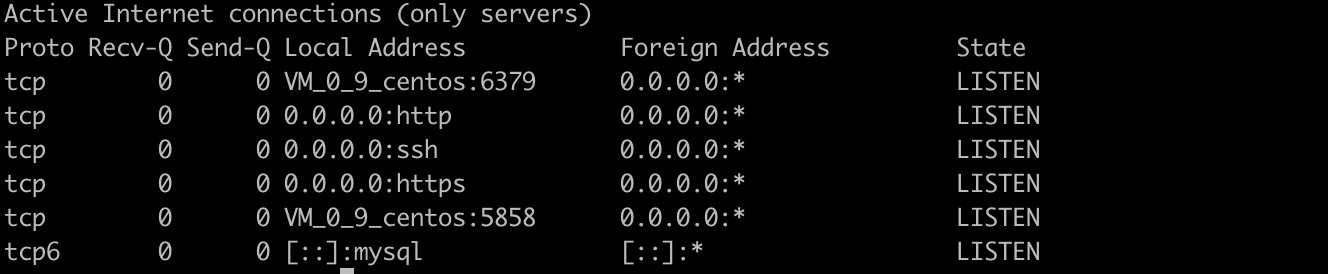
6、列出所有处于监听状态的 Sockets
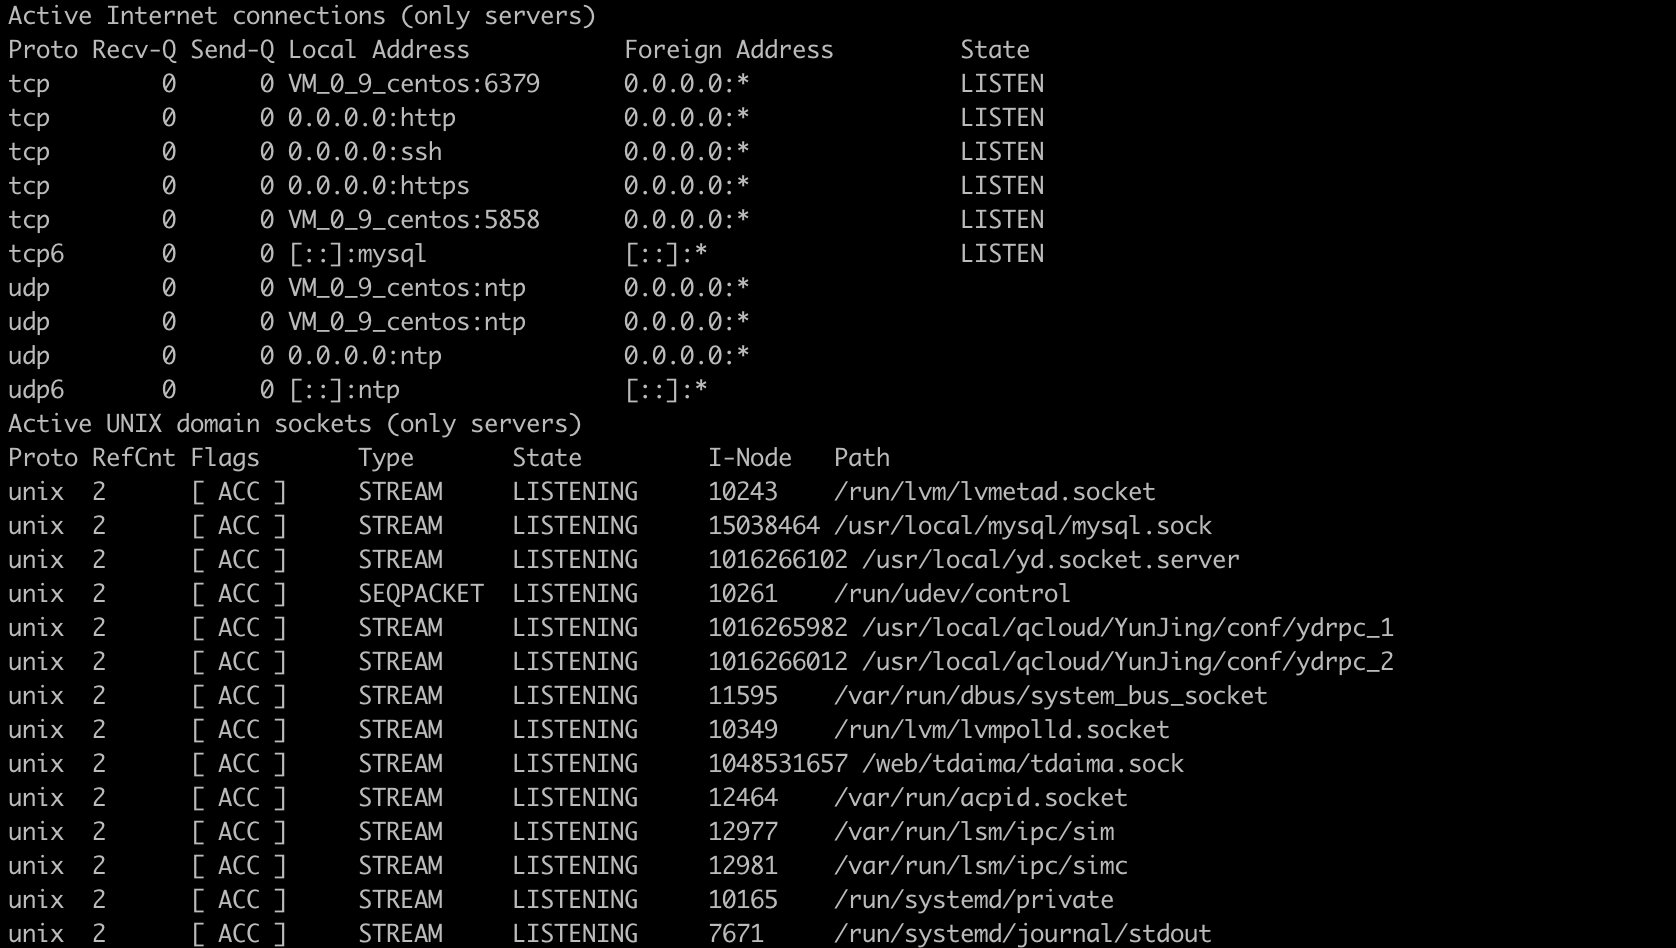
> netstat -l
7、只列出所有监听tcp端口
> netstat -lt
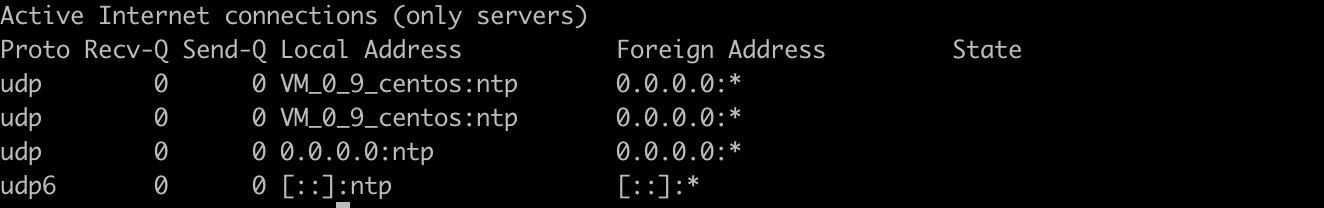
8、只列出所有监听udp端口
> netstat -lu
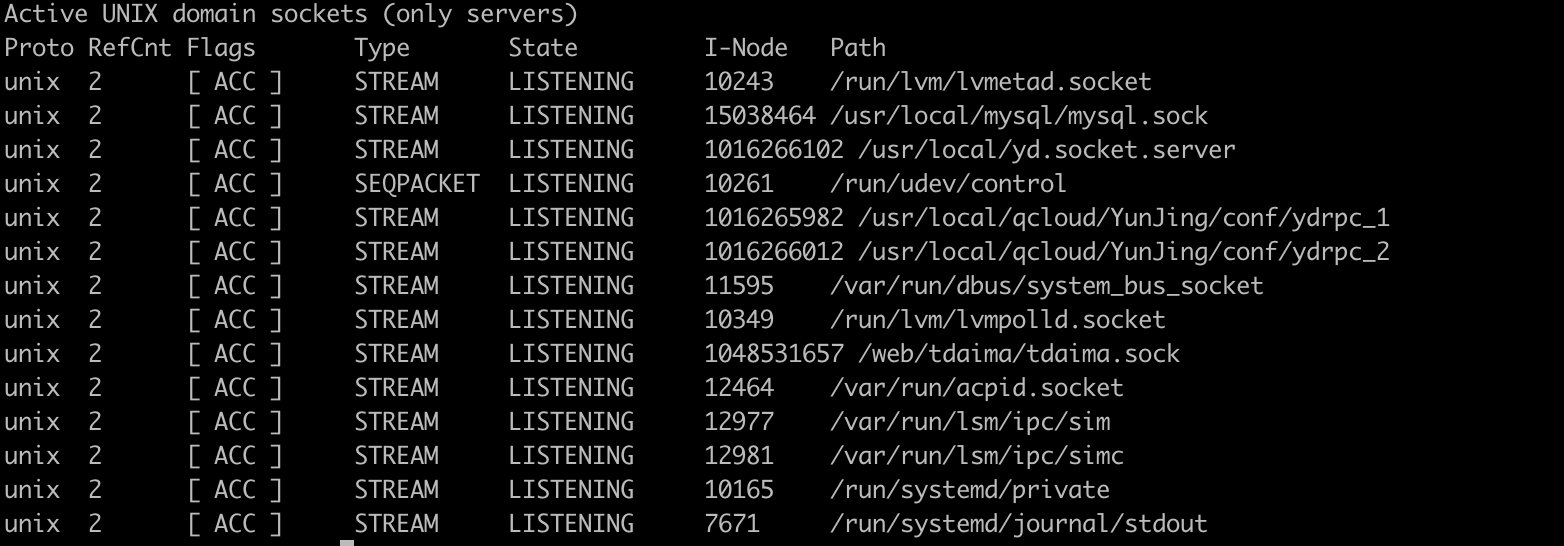
9、只列出所有监听UNIX端口
> netstat -lx
10显示所有端口的统计信息
> netstat -s
Ip:
    1007495197 total packets received
    0 forwarded
    582 with unknown protocol
    0 incoming packets discarded
    1007422115 incoming packets delivered
Icmp:
    66583265 ICMP messages received
    63899 input ICMP message failed.
    InCsumErrors: 384
    ICMP input histogram:
        destination unreachable: 115410
        timeout in transit: 12840
        source quenches: 11
        redirects: 563
        echo requests: 66453453
        echo replies: 152
        timestamp request: 438
        address mask request: 4
    66987000 ICMP messages sent
    0 ICMP messages failed
    ICMP output histogram:
        destination unreachable: 533106
        echo request: 4
        echo replies: 66453453
        timestamp replies: 437
IcmpMsg:
        InType0: 152
        InType3: 115410
        InType4: 11
        InType5: 563

IpExt:
    InNoRoutes: 15
    InMcastPkts: 1291307
    InOctets: 211446050816
    OutOctets: 481070069194
11、显示TCP端口的统计信息
> netstat -st
IcmpMsg:
    InType0: 152
    InType3: 115410
    InType4: 11
    InType5: 563
    InType8: 66453492
Tcp:
    55437641 active connections openings
    35899081 passive connection openings
    552243 failed connection attempts
    753118 connection resets received
    7 connections established
UdpLite:
TcpExt:
    162052 SYN cookies sent
    621 SYN cookies received
    4998179 invalid SYN cookies received
    551915 resets received for embryonic SYN_RECV sockets
IpExt:
    InNoRoutes: 15
    InMcastPkts: 1291308
    InOctets: 211446303015
    OutOctets: 481070459735
    InMcastOctets: 46487088
12、显示UDP端口的统计信息
> netstat -su
IcmpMsg:
    InType0: 152
    InType3: 115410
    InType4: 11
    InType5: 563
    InType8: 66453594
    InType11: 12840
    InType13: 438
    InType17: 4
    InType37: 3
    InType165: 7
    OutType0: 66453594
    OutType3: 533106
    OutType8: 4
    OutType14: 437
Udp:
    17941589 packets received
    637146 packets to unknown port received.
    1649 packet receive errors
    17977050 packets sent
    0 receive buffer errors
    0 send buffer errors
    InCsumErrors: 1640
UdpLite:
IpExt:
    InNoRoutes: 15
    InMcastPkts: 1291310
    InOctets: 211446802283
    OutOctets: 481071405083
    InMcastOctets: 46487160
    InNoECTPkts: 1009629627
    InECT1Pkts: 9955
    InECT0Pkts: 1987096
    InCEPkts: 94039
13、在netstat输出中显示 PID 和进程名称
> netstat -pt
14、在netstat输出中不显示主机,端口和用户名(host, port or user)
> netstat -an
15、持续输出netstat信息
每隔一秒输出网络信息
> netstat -c
16、显示核心路由信息
> netstat -r

Kernel IP routing table
Destination     Gateway         Genmask         Flags   MSS Window  irtt Iface
default         gateway         0.0.0.0         UG        0 0          0 eth0
link-local      0.0.0.0         255.255.0.0     U         0 0          0 eth0
172.16.0.0      0.0.0.0         255.255.240.0   U         0 0          0 eth0
17、使用netstat -rn显示数字格式,不查询主机名称。
> netstat -rn

Kernel IP routing table
Destination     Gateway         Genmask         Flags   MSS Window  irtt Iface
0.0.0.0         172.16.0.1      0.0.0.0         UG        0 0          0 eth0
169.254.0.0     0.0.0.0         255.255.0.0     U         0 0          0 eth0
172.16.0.0      0.0.0.0         255.255.240.0   U         0 0          0 eth0
18、找出程序运行的端口
> netstat -tunlp | grep ssh

tcp        0      0 0.0.0.0:22              0.0.0.0:*               LISTEN      4400/sshd
19、找出运行在指定端口的进程
> netstat -an | grep ":80"
tcp        0      0 0.0.0.0:80              0.0.0.0:*               LISTEN
tcp        0      0 172.16.0.9:80           185.191.171.12:9380     TIME_WAIT
tcp        0      0 172.16.0.9:80           185.191.171.26:52418    TIME_WAIT
tcp        0   3450 172.16.0.9:80           185.191.171.37:25108    FIN_WAIT1
tcp        0      0 172.16.0.9:80           185.191.171.37:55096    TIME_WAIT
tcp        0      0 172.16.0.9:80           144.76.176.171:27832    TIME_WAIT
tcp        0      0 172.16.0.9:80           118.126.124.7:11127     TIME_WAIT
tcp        0      0 172.16.0.9:46628        169.254.0.55:8080       TIME_WAIT
tcp        0      0 172.16.0.9:80           144.76.176.171:23812    ESTABLISHED
20、通过端口找进程ID
> netstat -tunlp | grep 80 | awk '{print $7}' | cut -d/ -f1
21323
21、显示网络接口列表
> netstat -i
Kernel Interface table
Iface             MTU    RX-OK RX-ERR RX-DRP RX-OVR    TX-OK TX-ERR TX-DRP TX-OVR Flg
docker0          1500        0      0      0 0             0      0      0      0 BMU
eth0             1450 462305568      0      0 0      276046945      0      0      0 BMRU
lo              65536  7204971      0      0 0       7204971      0      0      0 LRU
vpn_abi          1500 229612389      0 1023383 0      146640133      0    956      0 BMRU
22、统计TCP各种状态列表
> netstat -n | awk '/^tcp/{++S[$NF]}END{for(i in S) print i,S[i]}'
ESTABLISHED 7
FIN_WAIT2 13
TIME_WAIT 18
以上就是Linux的netstat命令详解的详细内容,更多关于Linux netstat命令的资料请关注本站其它相关文章!希望大家以后多多支持本站!
版权声明:本站文章来源标注为YINGSOO的内容版权均为本站所有,欢迎引用、转载,请保持原文完整并注明来源及原文链接。禁止复制或仿造本网站,禁止在非www.yingsoo.com所属的服务器上建立镜像,否则将依法追究法律责任。本站部分内容来源于网友推荐、互联网收集整理而来,仅供学习参考,不代表本站立场,如有内容涉嫌侵权,请联系alex-e#qq.com处理。
相关文章
 关注官方微信