利用Matlab提取图片曲线
利用 MATLAB 提取图片曲线
给你一张图片,如何提取里面曲线的数据,从而利用这些数据进行图像重绘、加工处理、测距、拟合得到函数表达式等操作呢?
行文动机
前段时间,有个朋友问了我一个问题,大概意思就是要给图像的流线测距离,在我的印象里面,MATLAB 是似乎没有这种直接的功能的。
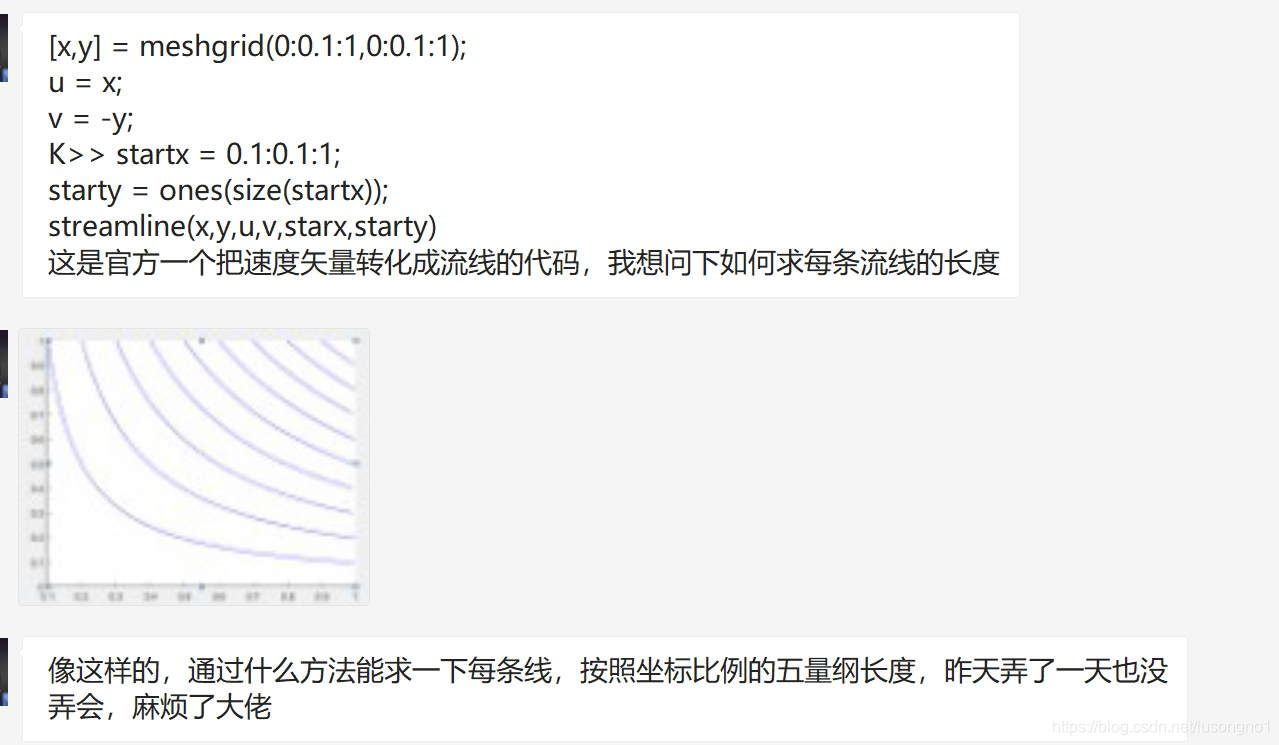
那么换个角度来理解一下这个问题,如果给你一张图像,如何提取里面点的数据?其实,有了曲线的数据,后面想干嘛就干嘛了。
一直没空弄这个,今天偷闲,安排!!!
图像的读入与裁剪
以下面的图像作为例子。
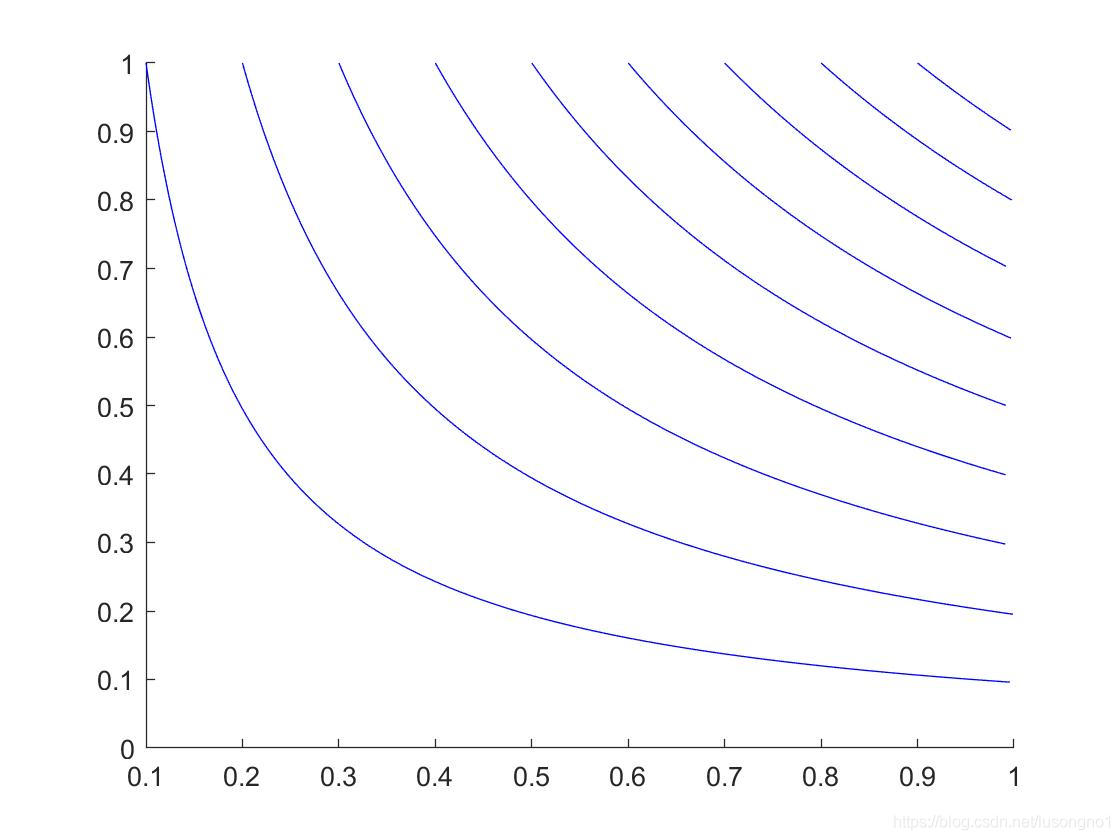
我们先导入图像,进行简单的裁剪。为什么要裁剪呢?其实不裁剪也没关系,因为我后面是基于像素点的颜色来提取的曲线。如果你想提取的曲线不能通过颜色区分,那么,最好通过裁剪,把你不想要的部分尽可能地剪掉。
%% 读入图片,展示,有必要的话可以适当做一些裁剪
A = imread('a.jpg');%读取到一张图片
imshow(A);
A = imcrop(A);%使用鼠标裁剪一波
imshow(A);
[low_num,col_num,~] = size(A);
颜色拾取
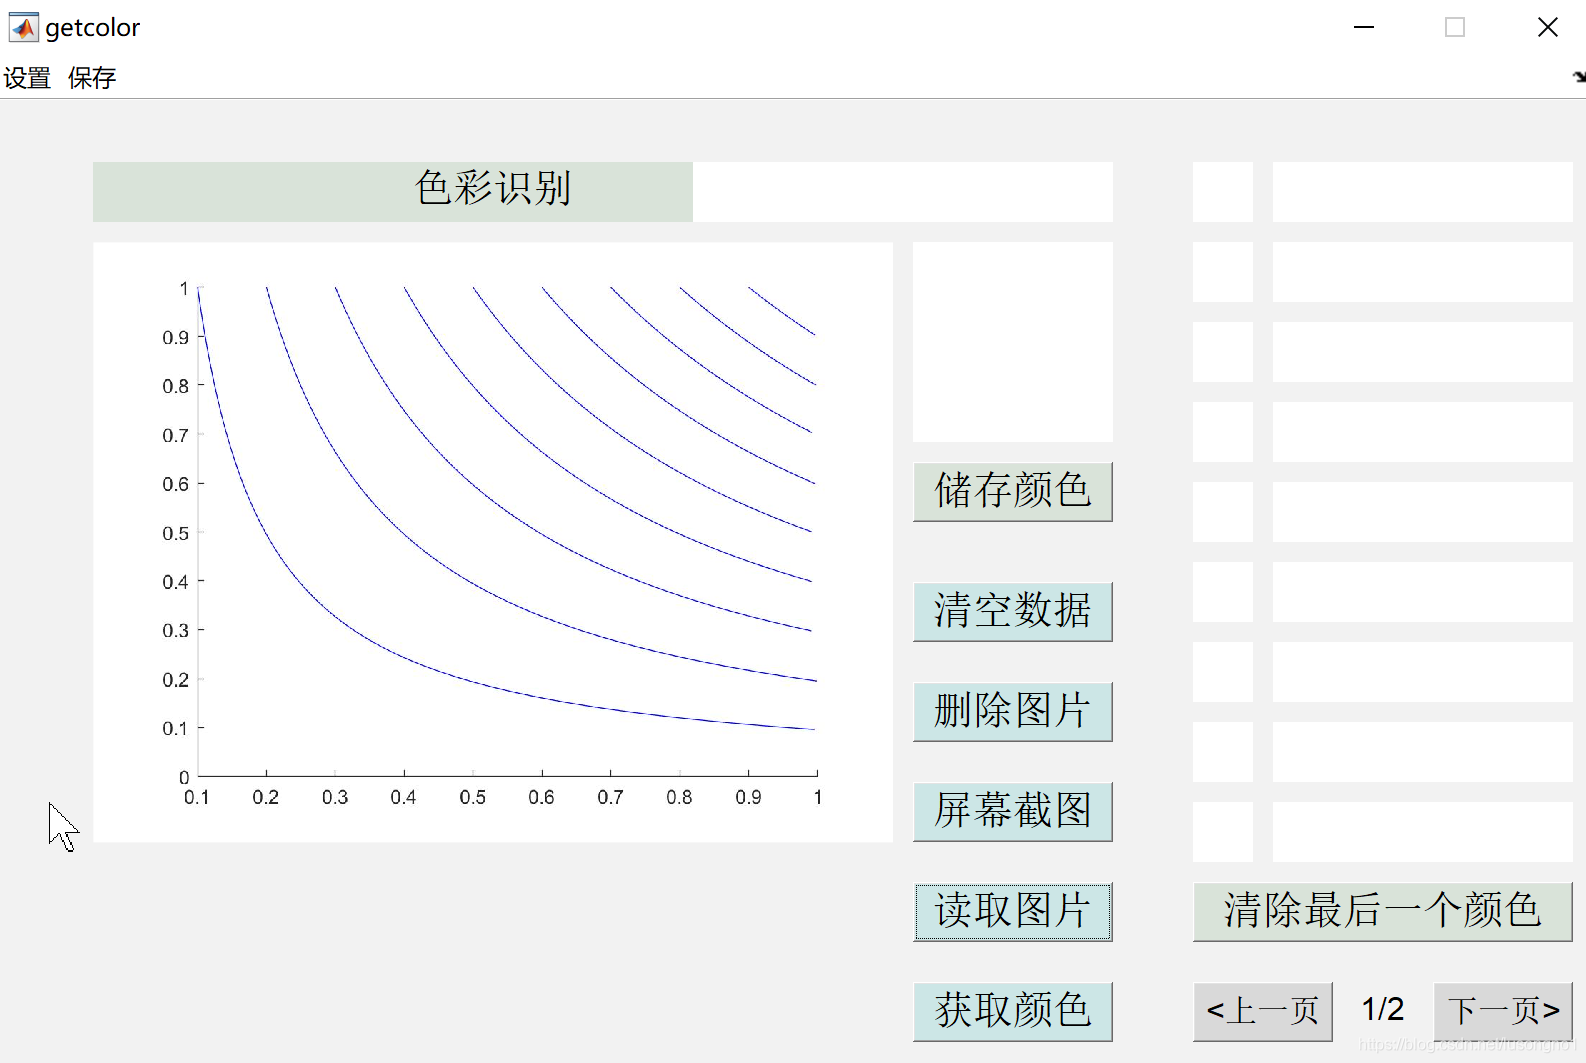
观察图像发现,我们要提取的曲线是蓝色的,所以我希望通过颜色把它区分出来。那么我们就要知道这个曲线的 RGB 值。我希望通过鼠标点选的方式获取到颜色值。
这里我偷个懒,直接采用了 slandarer 开源的颜色提取工具。这个模块不是我写的,特此声明,请尊重原创。
%% 颜色提取
getcolor();
color = color_list_temp(1,:);
function getcolor
global control;
global ima;
global GUI;
global x_limit;
global y_limit;
global color;
global a;
global color_number;
global color_list;
global page;
global total_page;
global color_list_temp;
color=[];
page=1;
total_page=2;
color_list=[0 0 0];
color_list(1,:)=[];
color_number=1;
rgb_type=1;
%%%%%%%%%%%%%%%%%%%%%%%%%%%%%%%%%%%%%%%%%%%%%%%%%%%%%%%%%%%%%%%%%%%%%%%%%%%
GUI.fig=figure('units','pixels',...
 'position',[350 100 800 500],...
 'Numbertitle','off',...
 'menubar','none',...
 'resize','off',...
 'name','getcolor',...
 'color',[0.95 0.95 0.95]);
%%%%%%%%%%%%%%%%%%%%%%%%%%%%%%%%%%%%%%%%%%%%%%%%%%%%%%%%%%%%%%%%%%%%%%%%%%%
uh1=uimenu('label','设置');
uimenu(uh1,'label','RGB类型设置','callback',@RGBset)
 function RGBset(~,~)
  GUI.rgbfig=figure('units','pixels',...
  'position',[360 370 180 200],...
  'Numbertitle','off',...
  'menubar','none',...
  'name','RGBset',...
  'resize','off');
  GUI.axes=axes('Units','pixels',...
'parent',GUI.rgbfig,...
  'PlotBoxAspectRatio',[1 1 1],...
  'Color',[0.95 0.95 0.95],...
  'Box','on', ...
  'XLim',[0 500],...
  'YLim',[0 500], ...
  'XColor',[0.95 0.95 0.95],...
  'YColor',[0.95 0.95 0.95],...
  'YDir','reverse', ...
  'xtick',[],'ytick',[]);
  GUI.checkbox1=uicontrol('parent',GUI.rgbfig,...
'style','checkbox',...
'string','范围:0-1',...
'position',[45 150 400 30],...
'fontsize',10,...
'value',rgb_type,...
'callback',@ifon1);
  GUI.checkbox255=uicontrol('parent',GUI.rgbfig,...
'style','checkbox',...
'string','范围:0-255',...
'position',[45 120 400 30],...
'fontsize',10,...
'value',~rgb_type,...
'callback',@ifon255);
  GUI.makesurebutton=uicontrol('parent',GUI.rgbfig,...
'style','pushbutton',...
'string','确定设置',...
'position',[45 70 100 25],...
'fontsize',10,...
'callback',@settype);

  function ifon1(~,~)
if(get(GUI.checkbox1,'value')==1)
 set(GUI.checkbox1,'value',1);
 set(GUI.checkbox255,'value',0);
else
 set(GUI.checkbox1,'value',1);
end
  end
  function ifon255(~,~)
if(get(GUI.checkbox255,'value')==1)
 set(GUI.checkbox255,'value',1);
 set(GUI.checkbox1,'value',0);
else
 set(GUI.checkbox255,'value',1);
end
  end
  function settype(~,~)
rgb_type=get(GUI.checkbox1,'value');
if ~isempty(color)
 set(GUI.text2,'string',['[',num2str((color/255).*rgb_type+color.*(~rgb_type)),']']);
end
show_color(page);
close(GUI.rgbfig)
  end
 end
%%%%%%%%%%%%%%%%%%%%%%%%%%%%%%%%%%%%%%%%%%%%%%%%%%%%%%%%%%%%%%%%%%%%%%%%%%%
uh2=uimenu('label','保存');
uimenu(uh2,'label','储存为mat','callback',@saveas_mat)
uimenu(uh2,'label','储存为txt','callback',@saveas_txt)
uimenu(uh2,'label','储存为excel','callback',@saveas_exl)
uimenupic=uimenu(uh2,'label','储存为对照图');
uimenu(uimenupic,'label','储存全部页码','callback',@saveas_pic_all);
uimenu(uimenupic,'label','储存当前页码','callback',@saveas_pic_now);
function saveas_mat(~,~)
 try
 [filename, pathname] = uiputfile({'*.mat','mat'});
  color_list_temp=(color_list/255).*rgb_type+color_list.*(~rgb_type);
  save([pathname,filename],'color_list_temp');
 catch
 end
end
function saveas_txt(~,~)
 try
 [filename, pathname] = uiputfile({'*.txt','记事本'});
  color_list_temp=(color_list/255).*rgb_type+color_list.*(~rgb_type);
  [m,n]=size(color_list_temp);
  fid=fopen([ pathname,filename],'w');
  for ii=1:m
for jj=1:n
 if jj==n
  fprintf(fid,'%d\r\n',color_list_temp(ii,jj));
 else
  fprintf(fid,'%d\r\t',color_list_temp(ii,jj));
 end
end
  end
  fclose(fid);
 catch
 end
end
function saveas_exl(~,~)
 [filename, pathname] = uiputfile({'*.xlsx','记事本'});
 color_list_temp=(color_list/255).*rgb_type+color_list.*(~rgb_type);
 xlswrite([ pathname,filename],color_list_temp)

end
function saveas_pic_all(~,~)
 page_with_color=total_page-1;
 px=50;
 gap_px=10;
 pic=ones(9*px,page_with_color*px+(page_with_color-1)*gap_px,3);
 for p=1:page_with_color
  for ii=(p-1)*9+1:p*9
for kk=1:3
 if ii<=length(color_list)
  pic((ii-(p-1)*9-1)*px+1:(ii-(p-1)*9)*px,(p-1)*(px+gap_px)+1:(p-1)*(px+gap_px)+px,kk)=color_list(ii,kk)/255;
 end
end
  end
 end
 [filename, pathname] = uiputfile({'*.jpg;*.png','All Image Files';...
'*.jpg','JPG';'*.png','PNG' });
 imwrite(pic,[pathname,filename]);
end
function saveas_pic_now(~,~)
 try
 [m,~]=size(color_list);
 m=m-(page-1)*9;
 m(m>9)=9;
 px=50;
 pic=ones(9*px,1*px,3);
 if m>0
  for ii=(page-1)*9+1:(page-1)*9+m
for kk=1:3
 pic((ii-1)*px+1:ii*px,1:px,kk)=color_list(ii,kk)/255;
end
  end
 else
 end
 [filename, pathname] = uiputfile({'*.jpg;*.png','All Image Files';...
'*.jpg','JPG';'*.png','PNG' });
 imwrite(pic,[pathname,filename]);
 catch
 end
end
%%%%%%%%%%%%%%%%%%%%%%%%%%%%%%%%%%%%%%%%%%%%%%%%%%%%%%%%%%%%%%%%%%%%%%%%%%%
%uh3=uimenu('label','导入');
%%%%%%%%%%%%%%%%%%%%%%%%%%%%%%%%%%%%%%%%%%%%%%%%%%%%%%%%%%%%%%%%%%%%%%%%%%%
GUI.text=uicontrol('parent',GUI.fig,...
 'style','text',...
 'string','色彩识别',...
 'horizontalalign','center',...
 'position',[50 440 400 30],...
 'backgroundcolor',[0.85 0.89 0.85],...
 'foregroundcolor','k',...
 'fontsize',15);
GUI.text1=uicontrol('parent',GUI.fig,...
 'style','text',...
 'string','',...
 'horizontalalign','center',...
 'position',[460 330 100 100],...
 'backgroundcolor',[1 1 1],...
 'foregroundcolor','k',...
 'fontsize',10);
GUI.text2=uicontrol('parent',GUI.fig,...
 'style','text',...
 'string','',...
 'horizontalalign','center',...
 'position',[350 440 210 30],...
 'backgroundcolor',[1 1 1],...
 'foregroundcolor','k',...
 'fontsize',10);
GUI.savecolorbutton=uicontrol('parent',GUI.fig,...
 'style','pushbutton',...
 'string','储存颜色',...
 'position',[460 290 100 30],...
 'backgroundcolor',[0.85 0.89 0.85],...
 'foregroundcolor','k',...
 'fontsize',15,...
 'callback',@save_color);
GUI.deletedatabutton=uicontrol('parent',GUI.fig,...
 'style','pushbutton',...
 'string','清空数据',...
 'position',[460 230 100 30],...
 'backgroundcolor',[0.8 0.9 0.9],...
 'foregroundcolor','k',...
 'fontsize',15,...
 'callback',@clear_data);
GUI.deletepicbutton=uicontrol('parent',GUI.fig,...
 'style','pushbutton',...
 'string','删除图片',...
 'position',[460 180 100 30],...
 'backgroundcolor',[0.8 0.9 0.9],...
 'foregroundcolor','k',...
 'fontsize',15,...
 'callback',@delete_pic);
GUI.getcapbutton=uicontrol('parent',GUI.fig,...
 'style','pushbutton',...
 'string','屏幕截图',...
 'position',[460 130 100 30],...
 'backgroundcolor',[0.8 0.9 0.9],...
 'foregroundcolor','k',...
 'fontsize',15,...
 'callback',@get_capture);
GUI.getpicbutton=uicontrol('parent',GUI.fig,...
 'style','pushbutton',...
 'string','读取图片',...
 'position',[460 80 100 30],...
 'backgroundcolor',[0.8 0.9 0.9],...
 'foregroundcolor','k',...
 'fontsize',15,...
 'callback',@getImage);
GUI.getcolorbutton=uicontrol('parent',GUI.fig,...
 'style','pushbutton',...
 'tag','recc',...
 'string','获取颜色',...
 'position',[460 30 100 30],...
 'backgroundcolor',[0.8 0.9 0.9],...
 'foregroundcolor','k',...
 'fontsize',15,...
 'callback',@get_color);
%%%%%%%%%%%%%%%%%%%%%%%%%%%%%%%%%%%%%%%%%%%%%%%%%%%%%%%%%%%%%%%%%%%%%%%%%%%
for i=1:9
 GUI.text=uicontrol('parent',GUI.fig,...
 'tag',num2str(i),...
 'style','text',...
 'string','',...
 'horizontalalign','left',...
 'position',[600 440-40*(i-1) 30 30],...
 'backgroundcolor',[1 1 1],...
 'foregroundcolor','k',...
 'fontsize',10);
end
for i=1:9
 GUI.text=uicontrol('parent',GUI.fig,...
 'tag',[num2str(i),'t'],...
 'style','text',...
 'string','',...
 'horizontalalign','center',...
 'position',[640 440-40*(i-1) 150 30],...
 'backgroundcolor',[1 1 1],...
 'foregroundcolor','k',...
 'fontsize',8);
end
%%%%%%%%%%%%%%%%%%%%%%%%%%%%%%%%%%%%%%%%%%%%%%%%%%%%%%%%%%%%%%%%%%%%%%%%%%%
GUI.inputbutton=uicontrol('parent',GUI.fig,...
 'style','pushbutton',...
 'string','清除最后一个颜色',...
 'position',[600 80 190 30],...
 'backgroundcolor',[0.85 0.89 0.85],...
 'foregroundcolor','k',...
 'fontsize',15,...
 'callback',@delete_last);
%GUI.inputbutton=uicontrol('parent',GUI.fig,...
 %'style','pushbutton',...
 %'string','导出数据',...
 %'position',[600 30 190 30],...
 %'backgroundcolor',[0.85 0.89 0.85],...
 %'foregroundcolor','k',...
 %'fontsize',15,...
 %'callback',@output_data);
%%%%%%%%%%%%%%%%%%%%%%%%%%%%%%%%%%%%%%%%%%%%%%%%%%%%%%%%%%%%%%%%%%%%%%%%%%%
GUI.lpbutton=uicontrol('parent',GUI.fig,...
 'style','pushbutton',...
 'string','<上一页',...
 'position',[600 30 70 30],...
 'backgroundcolor',[0.85 0.85 0.85],...
 'foregroundcolor','k',...
 'fontsize',12,...
 'callback',@lastpage);
GUI.npbutton=uicontrol('parent',GUI.fig,...
 'style','pushbutton',...
 'string','下一页>',...
 'position',[720 30 70 30],...
 'backgroundcolor',[0.85 0.85 0.85],...
 'foregroundcolor','k',...
 'fontsize',12,...
 'callback',@nextpage);
GUI.page=uicontrol('parent',GUI.fig,...
 'style','text',...
 'string',[num2str(page),'/',num2str(total_page)],...
 'horizontalalign','center',...
 'position',[670 30 50 27],...
 'backgroundcolor',[0.95 0.95 0.95],...
 'foregroundcolor','k',...
 'fontsize',12);
function lastpage(~,~)
 page=page-1;
 page(page<1)=1;
 set(GUI.page,'string',[num2str(page),'/',num2str(total_page)]);
 show_color(page);
end
function nextpage(~,~)
 page=page+1;
 page(page>total_page)=total_page;
 set(GUI.page,'string',[num2str(page),'/',num2str(total_page)]);
 show_color(page);
end
%%%%%%%%%%%%%%%%%%%%%%%%%%%%%%%%%%%%%%%%%%%%%%%%%%%%%%%%%%%%%%%%%%%%%%%%%%%
GUI.axes=axes('Units','pixels',...
'PlotBoxAspectRatio',[1 1 1],...
'Position',[50 30 400 400],...
'Color',[0.98 0.98 0.98],...
'Box','on', ...
'XLim',[0 500],...
'YLim',[0 500], ...
'XColor','w','YColor','w',...
'YDir','reverse', ...
'Tag','picbagaxes',...
'xtick',[],'ytick',[]);
hold on;
%%%%%%%%%%%%%%%%%%%%%%%%%%%%%%%%%%%%%%%%%%%%%%%%%%%%%%%%%%%%%%%%%%%%%%%%%%%
 %function output_data(~,~)
  %if color_number>1
%disp(color_list)
  %end
 %end
 function show_color(cur_page)
  len_list=size(color_list,1);
  for ii=(cur_page-1)*9+1:(cur_page-1)*9+9
if(ii<=len_list)
 set(findobj('tag',num2str(ii-(cur_page-1)*9)),'backgroundcolor',color_list(ii,:)/255)
 set(findobj('tag',[num2str(ii-(cur_page-1)*9),'t']),'string',['[',num2str((color_list(ii,:)/255).*rgb_type+color_list(ii,:).*(~rgb_type)),']'])
else
 set(findobj('tag',num2str(ii-(cur_page-1)*9)),'backgroundcolor',[1 1 1])
 set(findobj('tag',[num2str(ii-(cur_page-1)*9),'t']),'string','')
end
  end
 end
 function save_color(~,~)
  if ~isempty(get(GUI.text2,'string'))
%set(findobj('tag',num2str(color_number)),'backgroundcolor',color/255)
%set(findobj('tag',[num2str(color_number),'t']),'string',['[',num2str((color/255).*rgb_type+color.*(~rgb_type)),']'])
color_list(color_number,:)=color;%(color/255).*rgb_type+color.*(~rgb_type);
color_number=color_number+1;
if color_number-1>(total_page-1)*9
 page=ceil(color_number/9);
 total_page=total_page+1;
 set(GUI.page,'string',[num2str(page),'/',num2str(total_page)]);

end
show_color(page)
  end
 end
 function delete_last(~,~)
  if color_number>=1
%set(findobj('tag',num2str(color_number-1)),'backgroundcolor',[1 1 1])
%set(findobj('tag',[num2str(color_number-1),'t']),'string','')
color_list(end,:)=[];
color_number=color_number-1;
if color_number-2<=(total_page-2)*9
 page=ceil((color_number-1)/9);
 total_page=total_page-1;
 set(GUI.page,'string',[num2str(page),'/',num2str(total_page)]);

end
show_color(page)
  end
 end
 function delete_pic(~,~)
  control=0;
  set(findobj('Tag','picbagaxes'),...
  'XLim',[0 500],...
  'YLim',[0 500],...
  'Position',[50 30 400 400],...
  'Color',[0.98 0.98 0.98]);
  delete(a);
 end
 function clear_data(~,~)
  control=0;
  set(GUI.text1,'backgroundcolor',[1 1 1]);
  set(GUI.text2,'string','');
  set(findobj('Tag','picbagaxes'),...
  'XLim',[0 500],...
  'YLim',[0 500],...
  'Position',[50 30 400 400],...
  'Color',[0.98 0.98 0.98]);
  set(findobj('tag','recc'),'string','获取颜色');
  delete(a);
 end
 function get_color(~,~)
  if control==0
set(GUI.text1,'backgroundcolor',[1 1 1]);
set(GUI.text2,'string','');
  end
  control=1;
  set(gcf,'WindowButtonMotionFcn',@whilemovefcn)
  set(gcf,'WindowButtonDownFcn',@whileclickfcn)
 end
%%%%%%%%%%%%%%%%%%%%%%%%%%%%%%%%%%%%%%%%%%%%%%%%%%%%%%%%%%%%%%%%%%%%%%%%%%%
 function whilemovefcn(~,~)
  xy=get(gca,'CurrentPoint');
  x=xy(1,2);y=xy(1,1);
  if x<=x_limit&&y<=y_limit&&x>=0&&y>=0
x(x>x_limit)=x_limit;
y(y>y_limit)=y_limit;
x(x<1)=1;
y(y<1)=1;
x=round(x);
y=round(y);
if control==1
 color=double([ima(x,y,1),ima(x,y,2),ima(x,y,3)]);
 set(GUI.text1,'backgroundcolor',color/255);
 set(GUI.text2,'string',['[',num2str((color/255).*rgb_type+color.*(~rgb_type)),']']);
end
  else
if control==1
 set(GUI.text1,'backgroundcolor',[1 1 1]);
 set(GUI.text2,'string','');
end
  end
 end
 function whileclickfcn(~,~)
xy=get(gca,'CurrentPoint');
x=xy(1,2);y=xy(1,1);
if x<=x_limit&&y<=y_limit&&x>=0&&y>=0
 control=0;
 set(GUI.text1,'backgroundcolor',color/255);
 set(GUI.text2,'string',['[',num2str((color/255).*rgb_type+color.*(~rgb_type)),']']);
 set(findobj('tag','recc'),'string','继续取色');
 %disp(color/255)
end
 end
%%%%%%%%%%%%%%%%%%%%%%%%%%%%%%%%%%%%%%%%%%%%%%%%%%%%%%%%%%%%%%%%%%%%%%%%%%%
 function get_capture(~,~)
  screensize=get(0,'screensize');
  screensize=1.5*screensize;
  robot=java.awt.Robot();
  rectangle=java.awt.Rectangle();
  rectangle.x=0;
  rectangle.y=0;
  rectangle.width=screensize(3);
  rectangle.height=screensize(4);
  image=robot.createScreenCapture(rectangle);
  data=image.getData();
  temp=zeros(screensize(3)*screensize(4)*3,1);
  temp=data.getPixels(0,0,screensize(3),screensize(4),temp);
  temp=uint8(temp);
  R=temp(1:3:end);
  G=temp(2:3:end);
  B=temp(3:3:end);
  R=reshape(R,[screensize(3),screensize(4)]);
  G=reshape(G,[screensize(3),screensize(4)]);
  B=reshape(B,[screensize(3),screensize(4)]);
  R=R';
  G=G';
  B=B';
  x_limit=screensize(4);
  y_limit=screensize(3);
  leng=max([x_limit,y_limit]);
  set(findobj('Tag','picbagaxes'),...
  'XLim',[0 leng],...
  'YLim',[0 leng]);
  ima=cat(3,R,G,B);
  delete(a);
  a=imshow(ima);
 end
 function getImage(~,~)
  warning off;
  try
  [filename, pathname] = uigetfile({'*.jpg;*.tif;*.png;*.gif','All Image Files';...
'*.*','All Files' });
  ima = imread([ pathname,filename]);
  [x,y,~]=size(ima);
  x_limit=x;y_limit=y;
  leng=max([x_limit,y_limit]);
  set(findobj('Tag','picbagaxes'),...
  'XLim',[0 leng],...
  'YLim',[0 leng]);
  delete(a);
  a=imshow(ima);
  catch
  end
 end
end
颜色转换与色差计算
用 RGB 比较颜色之间的相似度时,存在很大的问题,不建议直接使用,因为往往一个通道的一点改变,会导致最后融合在一起的颜色发生巨大变化,而如果三个通道的同时改变,却只会使最后的明暗发生变化,色调并不会产生巨大变化。而这也是H系列色彩空间普遍存在的问题。
所以,经过思考,我决定 RGB 的值转为 HSV 颜色空间,再进行色差计算。
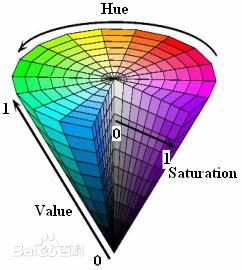
色差计算,直接利用两个点的颜色在椎体上的欧式距离,即通过计算如下坐标点的欧式距离。我们通过编写 color_dist 函数计算。
%计算两个 HSV 颜色之间的距离
function d = color_dist(color_std,color)
[x0,y0,z0] = getPos(color_std(1),color_std(2),color_std(3));
[x,y,z] = getPos(color(1),color(2),color(3));
d = sqrt((x-x0).^2+(y-y0).^2+(z-z0)^2);
end
function [x,y,z] = getPos(H,S,V)
r = 1;
h = sqrt(3);
x = r*V*S*cos(H);
y = r*V*S*sin(H);
z = h*(1-V);
end
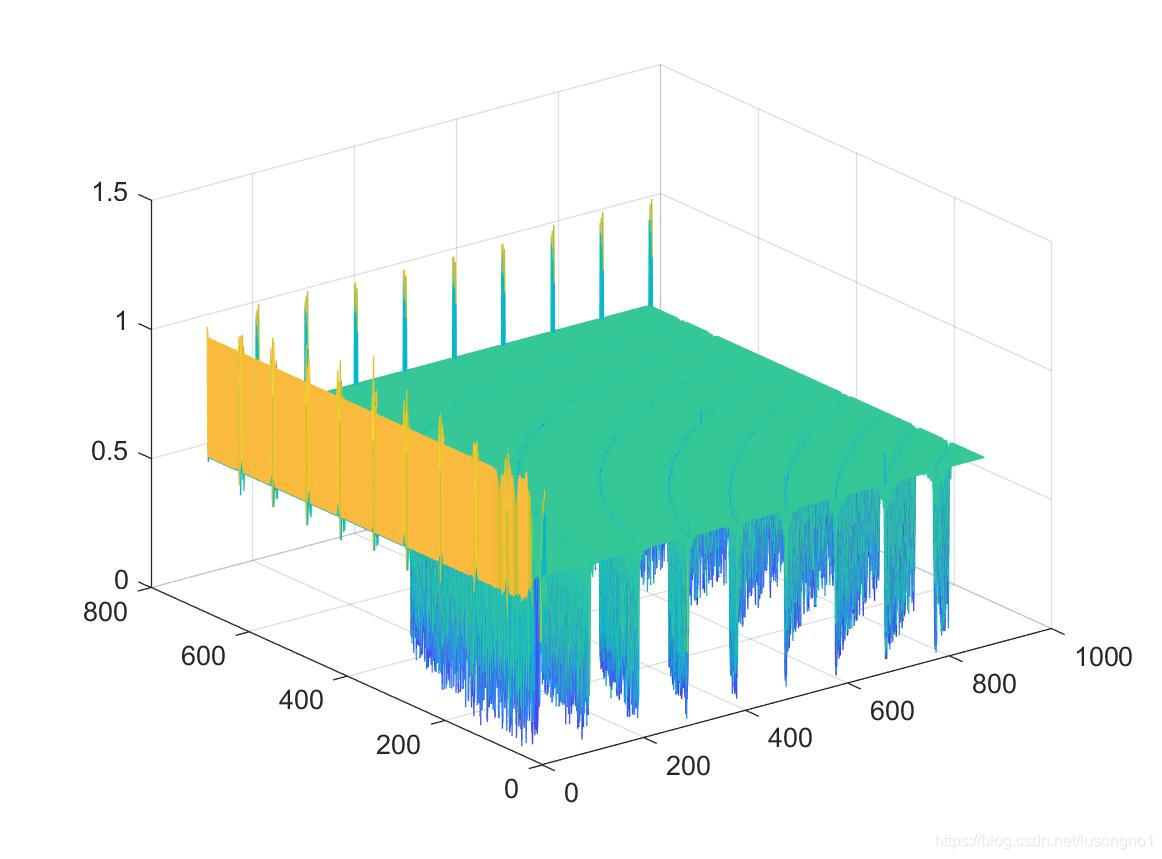
%% 颜色转为 HSV,再进行色差计算
A2 = rgb2hsv(A);
color2 = rgb2hsv(color);
D = ones(low_num,col_num)*2;
for i=1:low_num
 for j=1:col_num
  D(i,j) = color_dist(color2,A2(i,j,:));
 end
end
mesh(D);
分离曲线
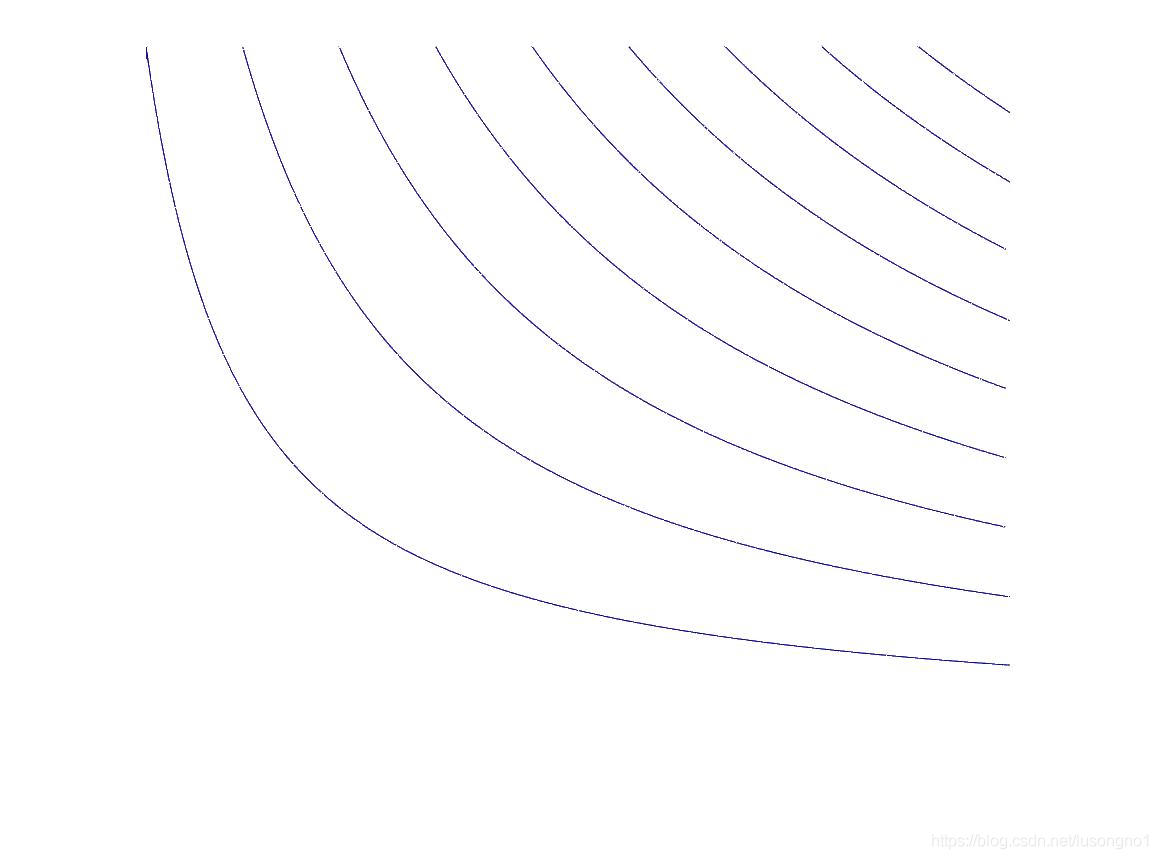
通过调节阈值参数,可以把我们想要的坐标轴过滤掉。阈值越小,过滤效果越明显。
%% 根据色彩,把想要的曲线分离出来
threshold = 0.5;%可以调整阈值使分离效果变好
I = (D<threshold);
for i=1:3
 RGB= A(:,:,i);
 RGB(~I)=255;
 A3(:,:,i) = RGB;
end
imshow(A3)
二值化,提取数据
二值化图像是以矩阵形式存储的。我们根据色素点在矩阵中的位置,利用行列指标和坐标轴的标准化关系,提取数据,重建坐标系。
%% 二值化,提取数据
leftUp = [0,1];%标注截取的图片的左上角和右下角
rightDown = [1,0];
B = rgb2gray(A3);
imshow(B);
[pos_row,pow_col] = find(B~=255);
Ps = [pos_row-1,pow_col-1];
Ps(:,1) = Ps(:,1)./(low_num-1);
Ps(:,2) = Ps(:,2)./(col_num-1);
x = (rightDown(1)-leftUp(1)).*Ps(:,2)+leftUp(1);
y = leftUp(2)-abs(rightDown(2)-leftUp(2)).*Ps(:,1);
scatter(x,y,0.38);
X = [x,y];
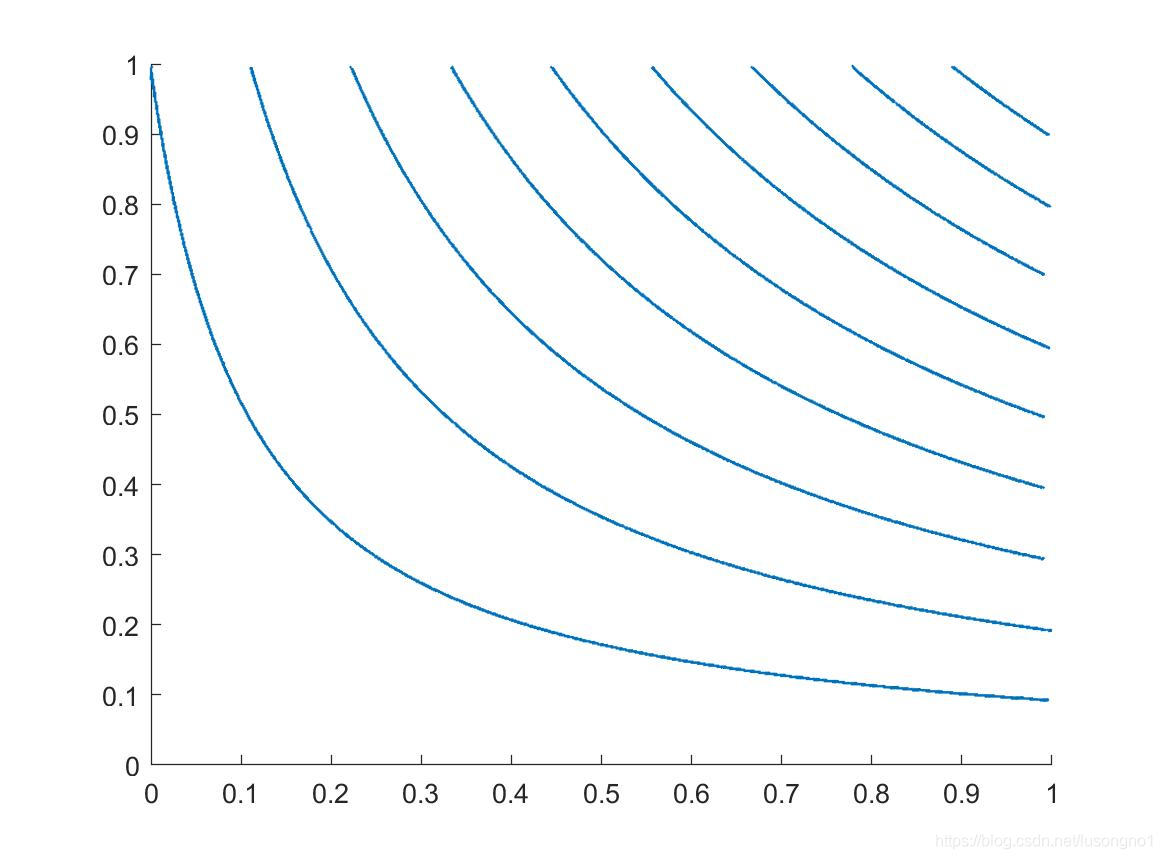
看着八九不离十了,但是注意这里的坐标点是以散点的形式画出来的。是无序且没有区分度的,我们甚至无法使用plot。
数据点分类与排序
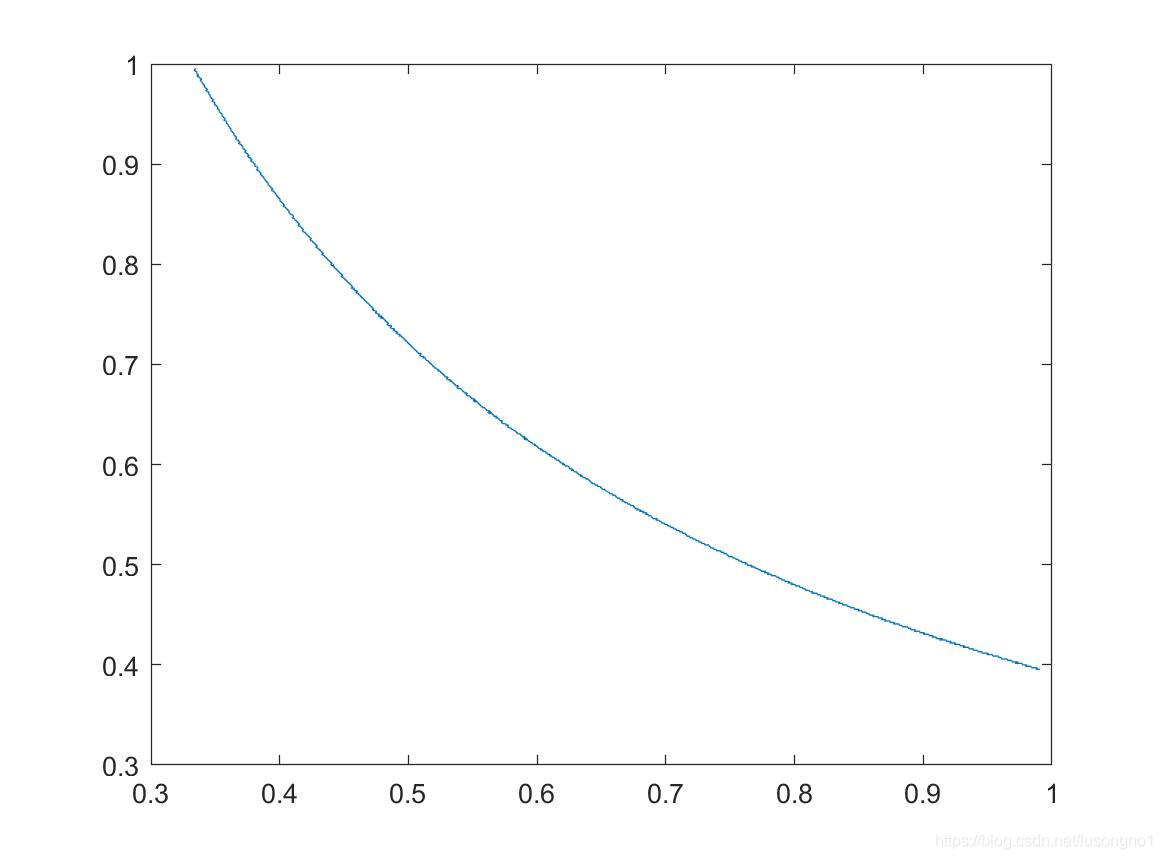
肉眼可见,这几条曲线是分隔开的。我们如何把这些数据按曲线分开且其上的点按顺序排好呢?我的做法是,使用鼠标选中你在意的曲线的一端,利用距离延拓法,还原整条曲线。
%% 数据分类与排序
N = size(X,1);
gfrom = ginput(1);
[~,minI] = min(sum((X - repmat(gfrom,N,1)).^2,2));
from = X(minI,:);
X(minI,:) = [];
X = [from;X];
tol = 0.01;
X1 = findcurvepath(X,tol);
plot(X1(:,1),X1(:,2))
其中用到了一个自己写函数 findcurvepath,它可以从一个数据点出发,把所有的数据点按距离远近,像串珍珠一样串在一块。
function ps1 = findcurvepath(ps0,tol)
%这个函数将点就近连接起来
ps1(1,1:2) = ps0(1,1:2);%将第一个取出来
ps0 = ps0(2:end,:);%ps0重置为剩下的部分
p = ps1(end,:);%p是取出来的最后一个
while ~isempty(ps0)

 i = 1;
 while 1
  distances = p2psdistance(p,ps0);
  inds = find(distances == min(distances));%%%%%%%修复一个bug
  if length(inds) > 1
if size(ps1,1)<i+1
 break;
end
p = ps1(end-i,:);%p是取出来的最后一个
i = i+1;
  else
break;
  end
 end

 distances = p2psdistance(p,ps0);
 if min(distances)>tol
  break;
 end
 inds = find(distances == min(distances));%%%%%%%修复一个bug
 ind = inds(1);
 ps1(end+1,1:2) = ps0(ind,1:2);
 ps0(ind,:) = [];
 p = ps1(end,:);
end
end
function distances = p2psdistance(p,ps)
distances = sqrt((p(1)-ps(:,1)).^2+(p(2)-ps(:,2)).^2);
end
后话
我不喜欢做 GUI,因为乱七八糟的界面用起来确实令人心烦。另外一方面,不管是 GUI 或者说进一步的 exe 桌面程序,都依赖于 MATLAB 的环境。也就是说,你要运行代码,就必须先装 MATLAB 的环境。试想,一个安装过和简单用过 MATLAB 的人,都是有能力可以通过代码修改一些参数的,那么你做 GUI 不是画蛇添足么。
到此这篇关于利用Matlab提取图片曲线的文章就介绍到这了,更多相关Matlab提取图片曲线内容请搜索本站以前的文章或继续浏览下面的相关文章希望大家以后多多支持本站!
版权声明:本站文章来源标注为YINGSOO的内容版权均为本站所有,欢迎引用、转载,请保持原文完整并注明来源及原文链接。禁止复制或仿造本网站,禁止在非www.yingsoo.com所属的服务器上建立镜像,否则将依法追究法律责任。本站部分内容来源于网友推荐、互联网收集整理而来,仅供学习参考,不代表本站立场,如有内容涉嫌侵权,请联系alex-e#qq.com处理。
 关注官方微信